I was working through the full newsletter this morning when I saw that the Minnesota 340B report dropped. So I think it’s worth a special edition today. That doesn’t mean there’s no other news. You’ll either get that later today as a rare Cost Curve twofer or tomorrow as a double edition.
For the record, the other big thing to highlight is the Sanofi 340B move (the WSJ exclusive is here) and the FDA commissioner nomination, about which I don’t have a lot to say. There are a lot of smaller, but still fascinating, other bits to pick up, too. No slow roll into Thanksgiving, I guess.
***
The Minnesota state report on 340B is now public. It’s indeed a milestone, and it ought to be a guide to how the program is approached going forward. My snap reading of the report is below, and I’m sure I’ll be back with corrections, clarifications, and alternative viewpoints as I — as well as the other 42 or 43 people who care deeply about 340B — sift through this.
The caveats belong up front. Because of the way that the Minnesota statute was written, there’s a lot of reporting that did not happen. Notably, data on office-administered drugs — think oncology meds — weren’t included in what providers passed along.
That oversight was corrected in legislation passed this year, but it leaves a gap in the first tranche of numbers: as much as 80% of 340B dollars are associated with medicines given in the office (as opposed to at the pharmacy).
So the topline number, $630 million in profits, is a “substantial underestimate.” That’s not my take. That’s how the state characterized the findings.
Stating the obvious, $630 million is still a lot of money. And it’s instructive to understand how the state arrived at the $630 million number.
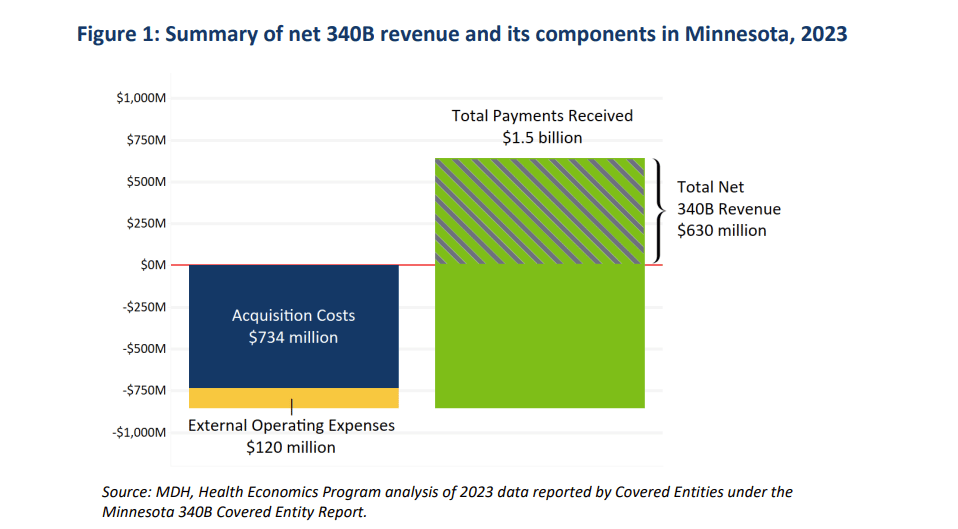
Minnesota providers spent $734 million to buy meds at 340B prices. Another $120 million went to “external operating expenses” (more on that in a moment). And the providers received $1.5 billion in reimbursement.
For those who like to see the math: $1.5B – ($734M + $120M) = $630M in net profit.
Here’s how the report visualizes things:
In terms of reactions, the Minneapolis Star-Tribune included comments from the Minnesota Hospital Association and PhRMA, along with perspective from 340B expert Sayeh Nikpay, from the University of Minnesota.
Lots of other nuggets to digest:
The $120 million in “external operating expenses” is what was siphoned off by contract pharmacies and third-party administrators, most of which are for-profit entities, many of which are owned by PBMs or private-equity firms. In other words, $16 of every $100 in 340B profit didn’t help patients or the providers. It got sucked up by middlemen. That’s a problem.
The math here is elegant: the average markup was apparently close to exactly 100%: buy for $734 million, sell for $1.5 billion. That masks substantial variation, and it’s unfortunate that we don’t see the office-administrered drugs (where we know the markups are even more outrageous). But it creates a helpful rule of thumb.
The report breaks down 340B profits on a drug-by-drug basis, which is illuminating. Every Humira scrip nets covered entities $3,400. Each insulin script brings in $400. Eliquis? $558.
It also shows 340B profits on a provider-by-provider basis, which is going to allow for some worthwhile calculations to be made, and — quite possibly — some great journalism to be performed. For instance, no hospital made more money from 340B than M Health Fairview University of Minnesota Medical Center ($129 million). That’s noteworthy, because, per the Pioneer Institute’s analysis of charity care, the University of Minnesota Medical Center spent 0.5% of its operating revenue on charity care in 2022. (The U.S. average was about 2.3%.) Should that raise questions about how that $129 million was spent?
Not everyone profits in the same way. Indeed, not everyone profits, period. Sure, U of M made more than $100 million in profits. But a handful of safety-net federal grantees showed a loss on 340B, meaning that they bought medicines but never got reimbursed. In other words: real charity care. That raises questions, too: is the system truly set up to support those who need the support the most?
This is only the start of the analysis. I can’t wait to how others look at and use the data. And I really can’t wait for next November, when we’ll presumably have a fuller look at actual 340B spending and some longitudinal data.


